


Introduction
Electric Vehicle Team (EVT) is an MIT student team dedicated to research into the future of electric vehicles and transportation systems. Their current focus is on hydrogen energy, building a fully open-source, Hydrogen fuel-cell powered motorcycle they plan to showcase at the World Hydrogen Summit in 2024. EVT works in key research areas including hydrogen fuel cell technology, storage, and production; power storage; powertrains, motors, and motor control. They also have several programs focused on community education in the areas of electronics design, and climate action.
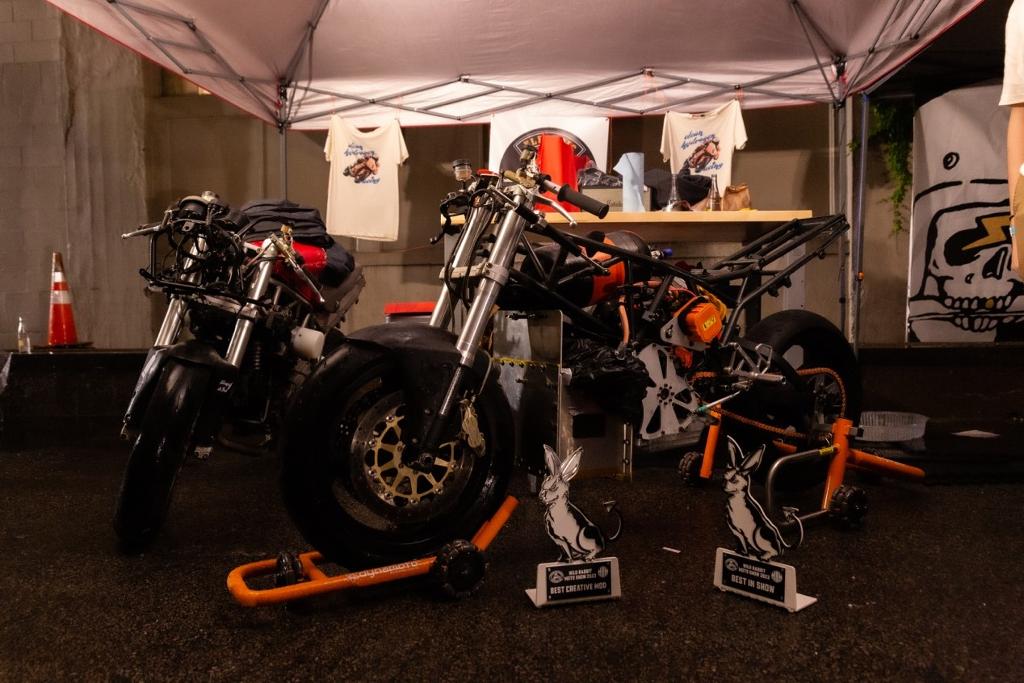
MIT EVT at the Wild Rabbit Community Moto Show, Cambridge, MA
The Challenge
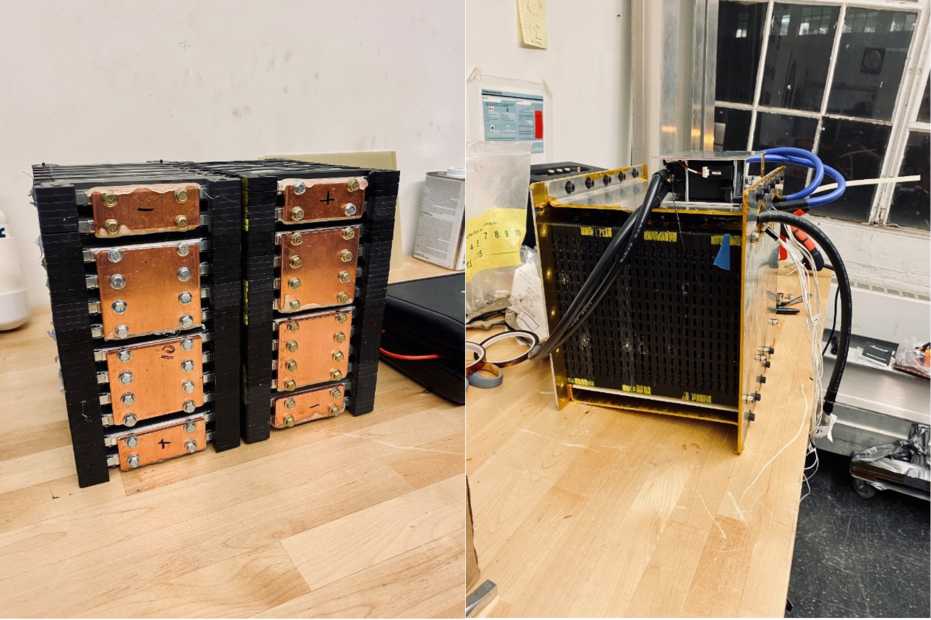
A common energy storage system is a Lithium-based battery pack. In this case, the pack consists of multiple SPIM08HP batteries, with a voltage of 50V and a capacity of 32Ah. These batteries are high-current, low-impedance lithium-ion pouch cells capable of providing and absorbing significant currents. During the design process, it is necessary to conduct various performance tests on the batteries, including measuring the internal resistance at the mΩ level. This measurement is crucial to assess the heat generation of the battery under load, which is particularly important for electric vehicles and other high-current systems, and to determine an appropriate cell configuration.
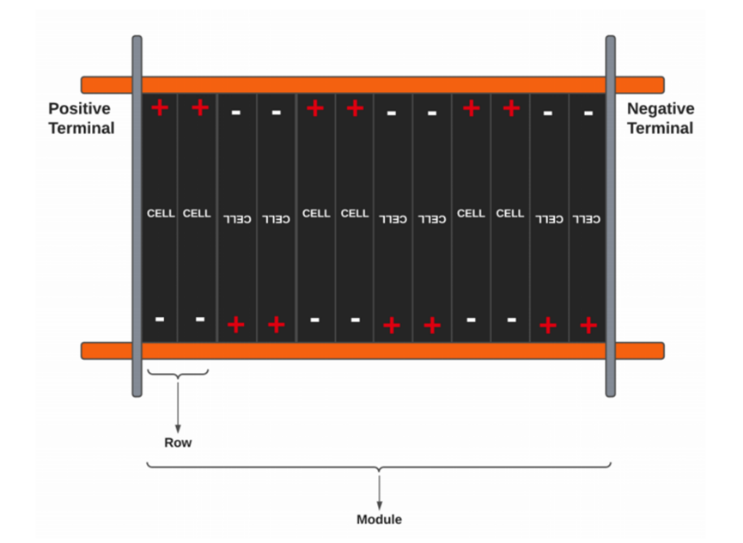
Visualization of a battery module with cells and rows1
Reference: 1 MIT Electric Vehicle Team, Version 1 Battery Design + Docs
The Solution
EVT has chosen RIGOL DC electronic loads to perform this part of the measurement.
Conventional testing solution:
When conducting internal resistance measurement on the battery under test, obtaining accurate readings of the battery voltage is crucial, while also minimizing noise in the readings. The conventional testing approach involves connecting the battery to a DC electronic load and applying the rated current (as specified in the battery datasheet). Using a digital oscilloscope (preferably equipped with a differential probe), the voltage drop across the battery under operating conditions is measured to calculate the battery's internal resistance value.
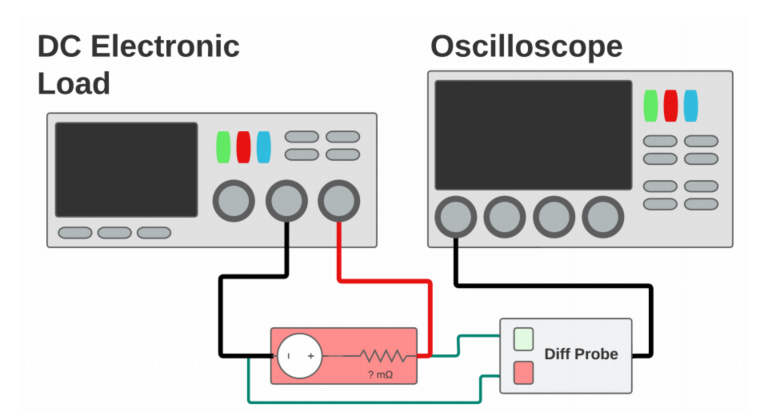
Visualization of a battery module with cells and rows2
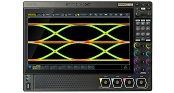
The discharge curve results presented through the oscilloscope provide a clear understanding of the voltage variation of the battery under operating conditions, allowing the calculation of the battery's equivalent internal resistance from the images. The graph comprises three stages-a flat region that represents the open-circuit-voltage, the voltage when the cell has no current flowing through it; a region with a sharp voltage drop due to the internal resistance and a region with a slow decay in voltage due to the discharge of the cell.
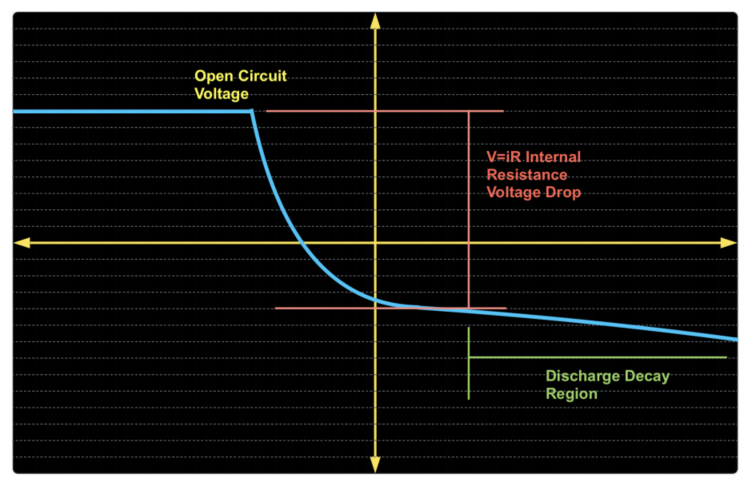
Typical scope output from cell V=iR test2
Reference: 2 MIT Electric Vehicle Team Battery Modeling + Internal Resistance Matching
New testing solution:
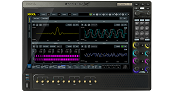
The RIGOL DL3031 electronic load is equipped with the S1501 Ultra Load software, which allows for configuration, display, and storage functions. Therefore, EVT's testing process does not require the use of a digital oscilloscope, significantly reducing laboratory testing costs and improving testing efficiency. Moreover, the DL3031A electronic load offers a voltage readback resolution of 0.1mV, which fulfills the project's testing precision requirements effectively.
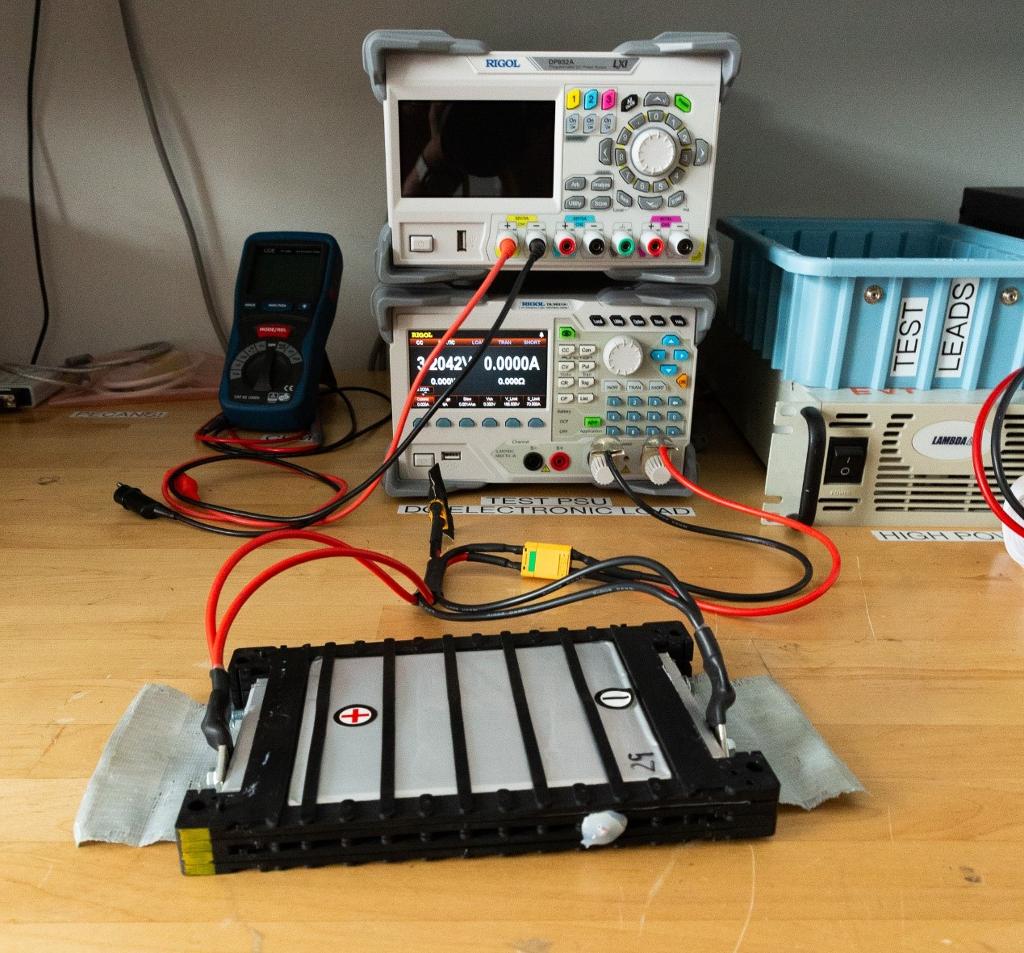
Bench setup with battery cell hooked up to DC electronic load, and load hooked up to PC running UltraLoad software via USB
The discharge curve obtained through readback with the electronic load clearly depicts the flat open-circuit voltage section, the initial voltage drop section, and the discharge attenuation section. From the discharge curve obtained in the following figure, these voltages can be easily read, and by performing calculations, the battery's internal resistance can be determined.
Looking at the discharge curve graph obtained through the readback of the electronic load, we can see a very clear initial voltage drop section, and discharge-decay section of the graph. We can easily read off these voltages and perform the calculation to determine the internal resistance.
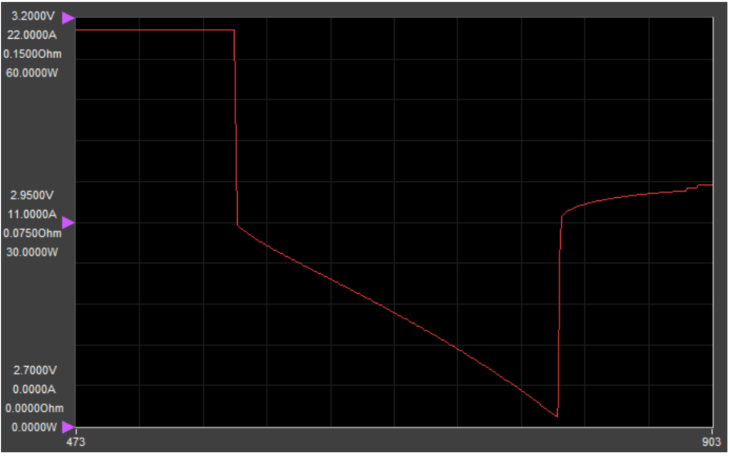
Load graph at 20A2
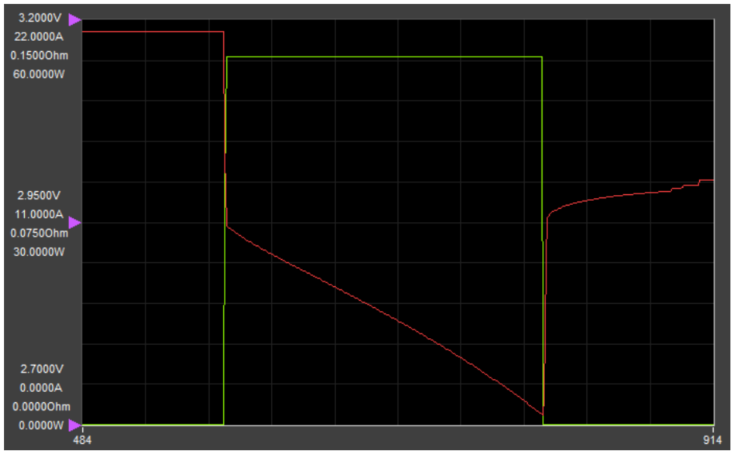
Load graph at 20A with current included2
Learn More: https://evt.mit.edu/blog/2023-7-23-battery_docs_v1/
Testimony
“It is through the support of RIGOL Technologies and collaboration with their engineers that we are able to perform the work we perform on battery systems and education. It allows our team to teach our students and members about the details of rigorous, robust electronics design and testing while also allowing us to provide access to specialized testing equipment to both the MIT and Cambridge community. Their support enables us to increase our depth of understanding, while providing resources to enable others to do the same.” ——MIT Electric Vehicle Team
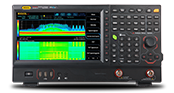
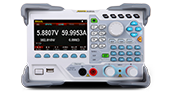
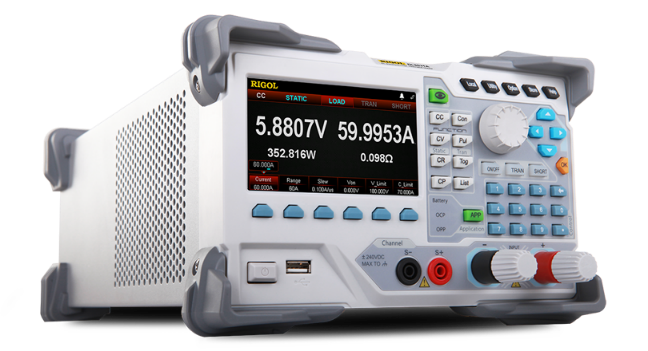
DL3000 Series Programmable DC Electronic Load
The DL3000 series is a cost-effective, economical programmable DC electronic load with a friendly human-machine interface and excellent performance specifications. It provides a variety of remote communication interfaces to meet diverse testing needs for design and testing. A wide range of solutions are available for a wide range of industries including automotive electronics and fuel cells.
- DL3021/DL3021A: single channel, DC150 V/40 A, total power up to 200 W
- DL3031/DL3031A: single channel, DC150 V/60 A, total power up to 350 W
Features:
- Dynamic mode: up to 30 kHz
- Adjustable current rising speed: 0.001 A/μs to 5 A/μs
- Min. readback resolution: 0.1 mV,0.1 mA
- 4.3-inch TFT LCD, capable of displaying multiple parameters and states simultaneously
- Overvoltage/overcurrent/overpower/overtemperature/reverse voltage protection
RIGOL has always been dedicated to electronic design, testing, production, and optimization, providing a wide range of solutions and product portfolios to meet customer needs. By strengthening technical capabilities in hardware, algorithms, and software, the company closely aligns with customer demands and market trends, continually exploring ways to enhance product applications across various industries.